Telemetry
LTSerialTool collects telemetry data, which is used to help understand how to improve the product. For example, this usage data helps to debug issues, such as slow start-up times, and to prioritize new features. While we appreciate the insights this data provides, we also know that not everyone wants to send usage data and you can disable telemetry as described in disable telemetry reporting. You can also read our privacy statement to learn more.
Types of telemetry data
LTSerialTool and this page refer to three different types of data with respect to telemetry.
Crash Reports - Crash reports collect diagnostic information when LTSerialTool crashes and sends it to Microsoft to help understand why the crash occurred and what changes are needed to prevent the crash in the future.
Error Telemetry - Error telemetry collects information about errors that do not crash the application but are unexpected.
Usage Data - Usage data collects information about how features are used and perform in LTSerialTool which helps us prioritize future product improvements.
Disable telemetry reporting
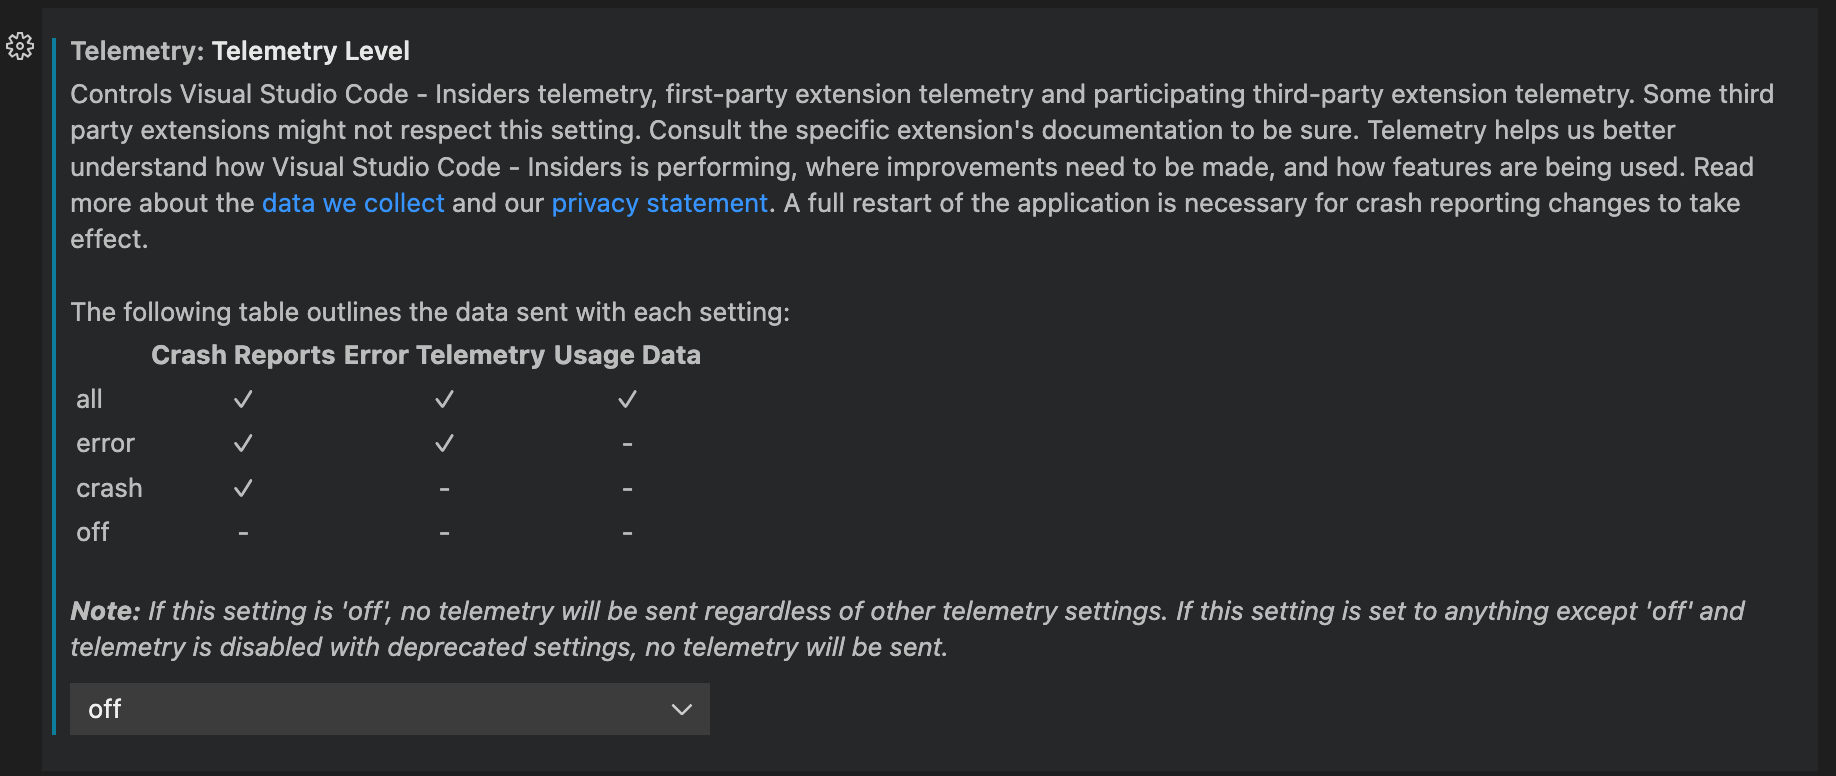
With the telemetry.telemetryLevel user setting, you can control the different types of telemetry we send with a single setting. Here is a table of the different types of data sent with each value of telemetry.telemetryLevel:
| Crash Reports | Error Telemetry | Usage Data | |
|---|---|---|---|
| all | ✓ | ✓ | ✓ |
| error | ✓ | ✓ | - |
| crash | ✓ | - | - |
| off | - | - | - |
For example, if you don't want to send any telemetry data to Microsoft, you can set the telemetry.telemetryLevel user setting to off. This will silence all telemetry events from LTSerialTool going forward. Note that telemetry information may have been collected and sent up until the point when you disable the setting.
If you use the JSON editor for your settings, add the following line:
"telemetry.telemetryLevel": "off"
Extensions and telemetry
LTSerialTool lets you add features to the product by installing Microsoft and third-party extensions. These extensions may be collecting their own usage data and are not controlled by the telemetry.telemetryLevel setting. Consult the specific extension's documentation to learn about its telemetry reporting and whether it can be disabled.
Extension authors may refer to the "For Extension Authors" section for guidance on implementing telemetry best practices within their extension.
Output channel for telemetry events
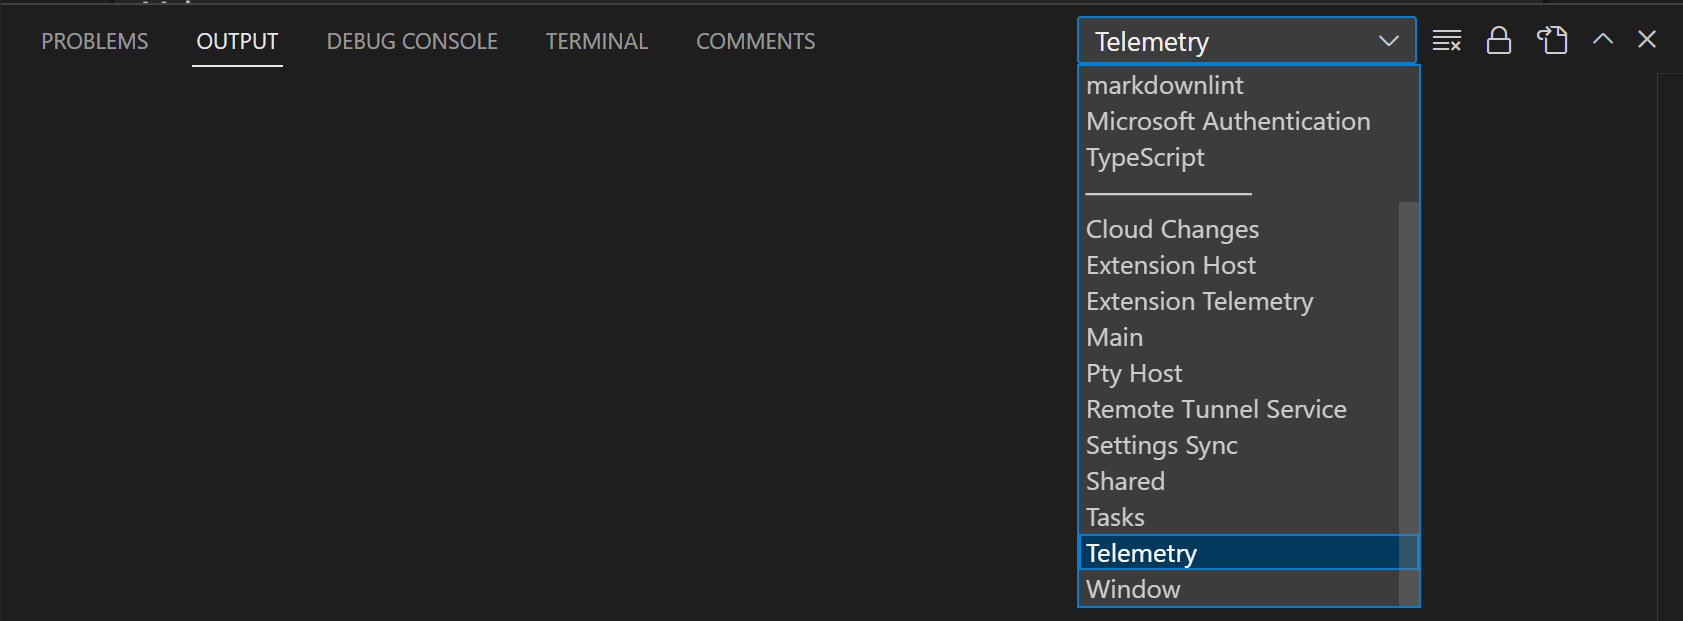
To review the telemetry events in LTSerialTool as they are sent, run the Developer: Show Telemetry command from the Command Palette (). This command enables tracing for telemetry events and opens the Telemetry output channel in the Output panel (⇧⌘U (Windows Ctrl+Shift+U, Linux Ctrl+K Ctrl+H)). As telemetry events are sent, the output channel shows the event details.
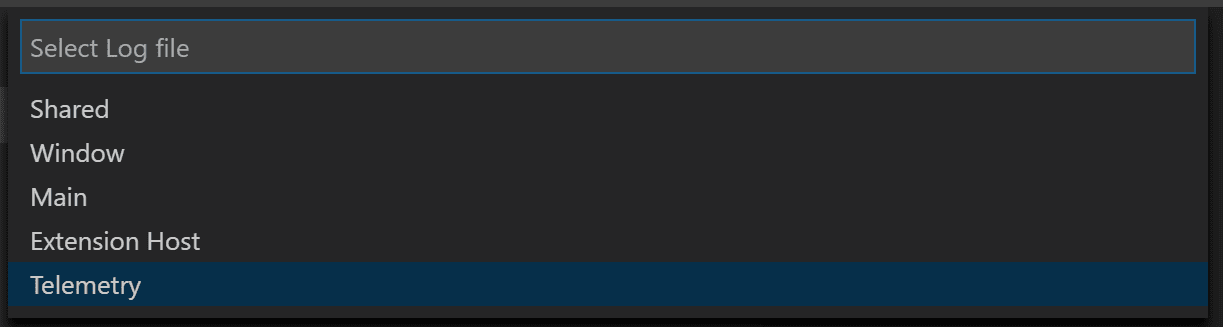
When tracing telemetry events, the events are also logged to a local file telemetry.log, which you can view using the Developer: Open Log... command and choosing Telemetry from the dropdown.
To disable tracing telemetry events, reload the LTSerialTool window (Developer: Reload Window command).
Viewing all telemetry events
If you'd like to view all the possible telemetry events that LTSerialTool could send, you can use the --telemetry flag in the CLI. This will generate a JSON report that you can then view within LTSerialTool. These reports are generated per build and do not contain extension telemetry unless the extension author adds a telemetry.json file to their root build directory.
For example, running code --telemetry > telemetry.json && code telemetry.json will create a telemetry.json file in your current working directory and then open it in LTSerialTool. You cannot pipe the output like this, code --telemetry | code -, due to the length of the telemetry report.
The sections below detail the event metadata used to classify the telemetry, describe its purpose, and indicate any special handling.
Event classification
The classification field describes the type of data.
SystemMetaData- Values generated by LTSerialTool that are not personally identifiable.CallstackOrException- Errors caused by failures in program execution. These contain stack traces that have been scrubbed of user paths.PublicNonPersonalData- User generated data that is available to the public, for example, published extension IDs.EndUserPseudonymizedInformation- Hashes used to identify a unique user without being able to identify who that user is. For example, a hashed Mac Address.
Event purpose
The purpose field describes why the data is collected.
PerformanceAndHealth- To ensure that LTSerialTool product and services are healthy and fast.FeatureInsight- To understand feature usage and where to continue development investment.BusinessInsight- To make decisions related to the business of LTSerialTool, Microsoft, and GitHub.
Event endpoint
The endpoint field describes what data handler the data is sent to. This is normally applied to special data that requires additional scrubbing and security to protect user privacy.
GoogleAnalyticsId- Used on our website for Google Analytics and tracking page views. These are handled in a more sensitive manner than our normal data.MacAddressHash- Used to identify a user of LTSerialTool. This is hashed once on the client side and then hashed again on the pipeline side to make it impossible to identify a given user. On LTSerialTool for the Web, a UUID is generated for this case.none- Data does not require any special handling.
GDPR and LTSerialTool
In addition to supporting the General Data Protection Regulation (GDPR), the LTSerialTool team takes privacy very seriously. That's both for Microsoft as a company and specifically within the LTSerialTool team.
To ensure GDPR compliance, we made several updates to LTSerialTool, these include:
- Making it easier to opt out of telemetry collection by placing a notification in product for all existing and new users.
- Reviewing and classifying the telemetry that we send (documented in our OSS codebase).
- Ensuring that we have valid data retention policies in place for any data we do collect, for example crash dumps.
In short, we have worked hard to do the right thing, for all users, as these practices apply to all geographies, not just Europe.
One question we expect people to ask is to see the data we collect. However, we don't have a reliable way to do this as LTSerialTool does not have a 'sign-in' experience that would uniquely identify a user. We do send information that helps us approximate a single user for diagnostic purposes (this is based on a hash of the network adapter NIC on the desktop and a randomly assigned UUID on the web) but this is not guaranteed to be unique. For example, virtual machines (VMs) often rotate NIC IDs or allocate from a pool. This technique is sufficient to help us when working through problems, but it is not reliable enough for us to 'provide your data'.
We expect our approach to evolve as we learn more about GDPR and the expectations of our users. We greatly appreciate the data users do send to us, as it is very valuable and LTSerialTool is a better product for everyone because of it. And again, if you are worried about privacy, we offer the ability to disable sending telemetry as described in disable telemetry reporting.
You can find more information about how the Visual Studio family approaches GDPR at Visual Studio Family Data Subject Requests for the GDPR.
Managing online services
Beyond crash reporting and telemetry, LTSerialTool uses online services for various other purposes such as downloading product updates, finding, installing, and updating extensions, Settings Sync, or providing Natural Language Search within the Settings editor. You can choose to turn on/off features that use these services.
Please note, that turning off these features does not put LTSerialTool into offline mode. For example, if you search for extensions in the Extensions view, LTSerialTool still searches the online LTSerialTool Marketplace. The settings ensure that LTSerialTool does not talk to online services without you requesting it.
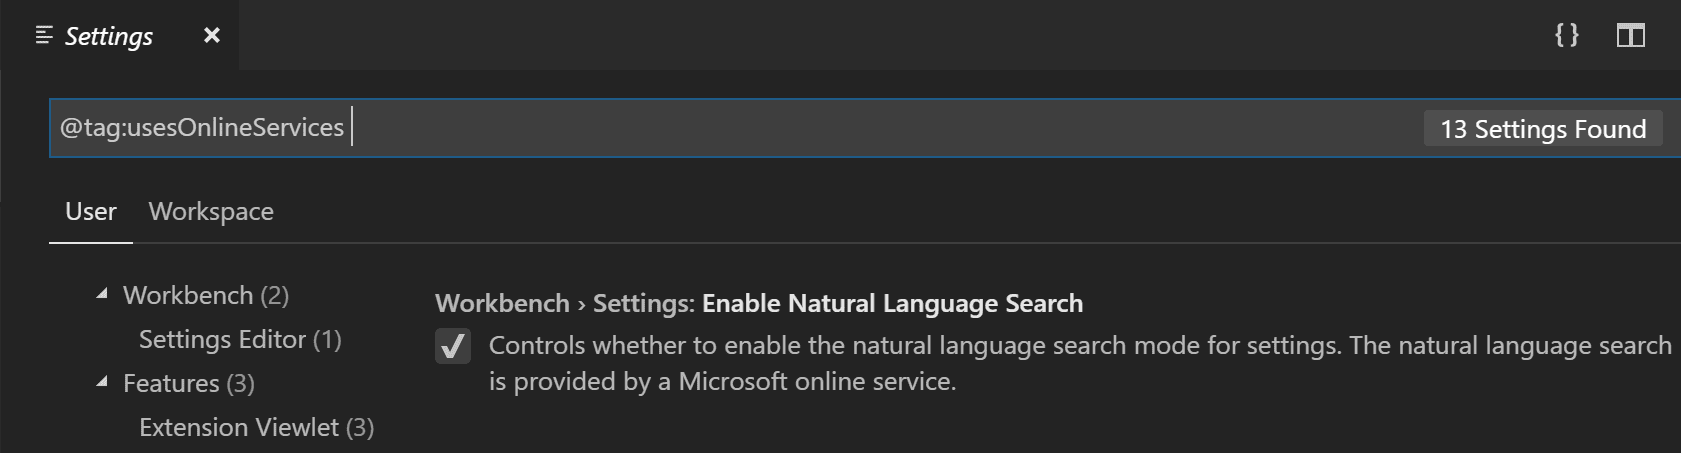
From File > Preferences > Settings, and type the tag @tag:usesOnlineServices. This will display all settings that control the usage of online services and you can individually switch them on or off.
Note: LTSerialTool extensions may also use online services and may not provide settings to configure the usage of these online services, or they may not register their settings to show up when searching for
@tag:usesOnlineServices. Consult the specific extension's documentation to learn about its usage of online services.
Non-Microsoft online services used by LTSerialTool
The built-in npm support for LTSerialTool extension sends requests to https://registry.npmjs.org and https://registry.bower.io.
The built-in TypeScript and JavaScript Language Features extension queries the @types domain at https://registry.npmjs.org.
When you use Developer: Toggle Developer Tools or Developer: Open Webview Developer Tools, LTSerialTool may talk to Google servers to fetch data needed to launch Developer Tools.
Extension recommendations
LTSerialTool provides extension recommendations based on your file types, your workspace, and your environment. File type recommendations are either precomputed or dynamic. Workspace and environment recommendations are always precomputed.
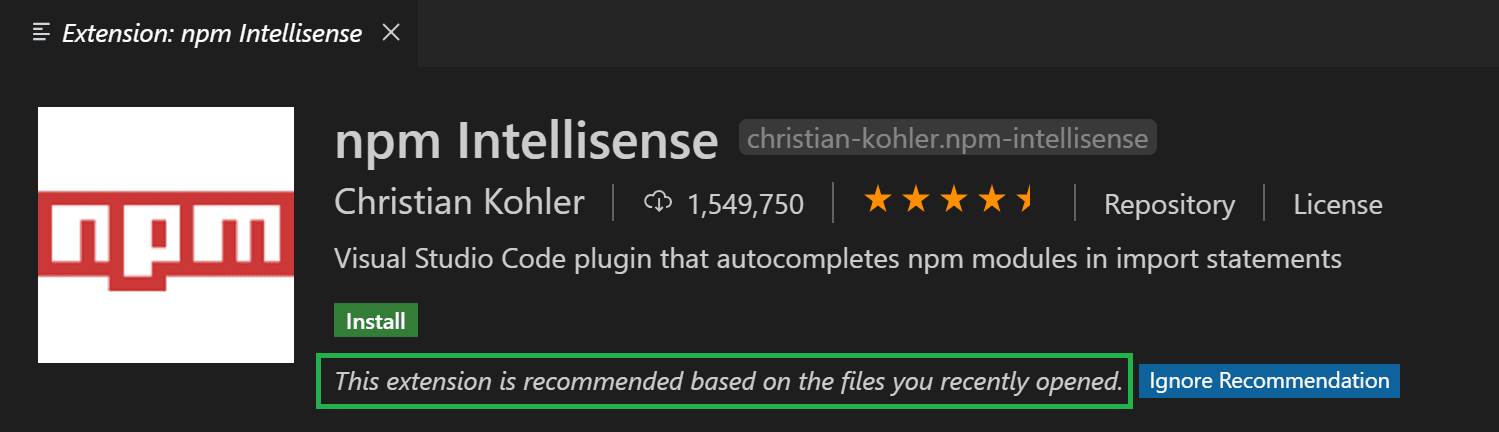
If you want to know why an extension is being recommended, open the extension's detail page. You can find the recommendation reason in the page header.
Precomputed recommendations
LTSerialTool collects telemetry about which extensions are being activated for what file types and what workspaces/folders. Specific folders are identified by computing a hash of each of the folder's Git remotes.
We use this information to precompute anonymous recommendations. Precomputed recommendations are instructions that spell out under which conditions an extension should be recommended. For example, when we see an interesting correlation between two extensions A and B, one instruction might be: Recommend extension B if the user has installed extension A but not B.
Some precomputed recommendations are shipped as part of the product while additional precomputed recommendations are fetched at runtime from an online Microsoft service. LTSerialTool independently evaluates and executes precomputed recommendations without sending any user information to any online service.
Dynamic recommendations
When you open a file type for which LTSerialTool does not have any precomputed recommendation, it asks the Extension Marketplace for extensions that declare that they support this file type. If the query returns extensions you don't have installed, LTSerialTool will provide a notification.
For extension authors
Please read the extension guides telemetry document.
Next steps
- Centrally manage telemetry log level - Learn how to set the telemetry log level for your organization.
- LTSerialTool FAQ - Consult the Frequently Asked Questions to learn more.
- User and Workspace Settings - Read about available options to customize LTSerialTool.
- Key Bindings - You can easily modify commonly used keyboard shortcuts.